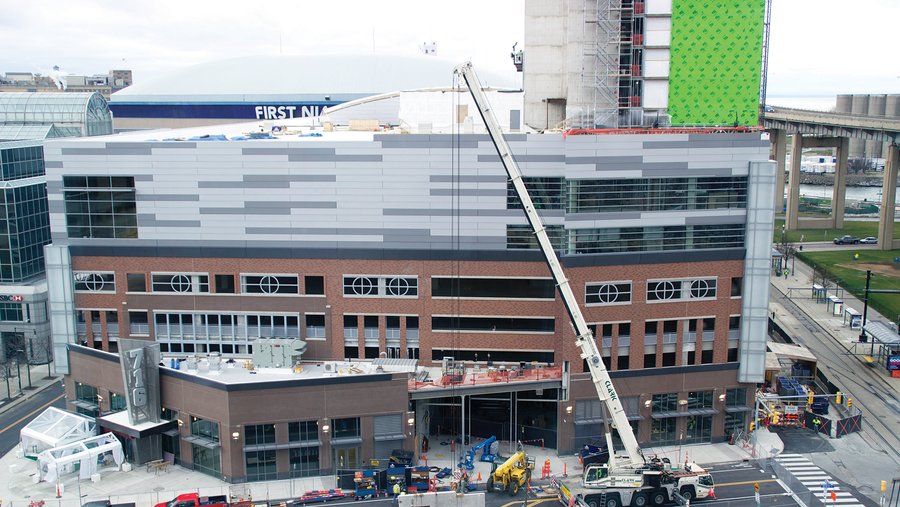
The current boom in downtown construction has earned Buffalo a distinctive honor. It now ranks as the hottest construction market in the Northeastern United States.
That’s according to the latest employment figures from the U.S. Bureau of Labor Statistics (BLS), which show the number of local construction jobs soaring by 28.6 percent during the past five years.
No other metro in the Northeast can match that growth rate. Boston is a close second at 28.4 percent, and New York City is a distant third at 20.2 percent. Every other market in the region has a five-year growth rate below 20 percent.
Business First compared construction statistics for the 21 major Northeastern markets in October 2010 and the same month this year. The latter is the most recent month available.
The Buffalo area, which includes Erie and Niagara counties, added 6,000 construction jobs over the five-year span. It jumped from 21,000 jobs five years ago to 27,000 now.
Twenty of the 21 markets reported increases, reflecting gradual improvement from the depths of the Great Recession of 2008-2009. The exception is Syracuse, which lost 6.1 percent of its construction jobs during the half-decade.
MARKET-BY-MARKET RATES
Here are the growth rates for the construction sectors in all 21 Northeastern markets:
• 1. Buffalo, up 28.6% from 21,000 construction jobs in October 2010 to 27,000 jobs in October 2015.
• 2. Boston, up 28.4% from 82,000 construction jobs in October 2010 to 105,300 jobs in October 2015.
• 3. New York City, up 20.2% from 314,700 construction jobs in October 2010 to 378,300 jobs in October 2015.
• 4. Springfield, Mass., up 14.6% from 10,300 construction jobs in October 2010 to 11,800 jobs in October 2015.
• 5. Philadelphia, up 13.8% from 103,700 construction jobs in October 2010 to 118,000 jobs in October 2015.
• 6. Baltimore, up 13.4% from 69,200 construction jobs in October 2010 to 78,500 jobs in October 2015.
• 7. Portland, Maine, up 12.6% from 8,700 construction jobs in October 2010 to 9,800 jobs in October 2015.
• 8. Rochester, N.Y., up 12.4% from 18,600 construction jobs in October 2010 to 20,900 jobs in October 2015.
• 9. Albany, N.Y., up 11.9% from 17,600 construction jobs in October 2010 to 19,700 jobs in October 2015.
• 10. Bridgeport-Stamford, Conn., up 11.4% from 11,400 construction jobs in October 2010 to 12,700 jobs in October 2015.
• 11. Scranton-Wilkes-Barre, Pa., up 11.1% from 9,900 construction jobs in October 2010 to 11,000 jobs in October 2015.
• 12. Harrisburg, Pa., up 11.0% from 10,900 construction jobs in October 2010 to 12,100 jobs in October 2015.
• 12. Hartford, up 11.0% from 18,100 construction jobs in October 2010 to 20,100 jobs in October 2015.
• 14. Pittsburgh, up 9.7% from 52,400 construction jobs in October 2010 to 57,500 jobs in October 2015.
• 15. Allentown-Bethlehem, Pa., up 8.5% from 13,000 construction jobs in October 2010 to 14,100 jobs in October 2015.
• 15. Washington, up 8.5% from 143,900 construction jobs in October 2010 to 156,100 jobs in October 2015.
• 17. Worcester, Mass., up 7.9% from 8,900 construction jobs in October 2010 to 9,600 jobs in October 2015.
• 18. Lancaster, Pa., up 6.1% from 14,800 construction jobs in October 2010 to 15,700 jobs in October 2015.
• 19. Providence, up 5.8% from 20,800 construction jobs in October 2010 to 22,000 jobs in October 2015.
• 20. New Haven, Conn., up 2.2% from 9,300 construction jobs in October 2010 to 9,500 jobs in October 2015.
• 21. Syracuse, N.Y., down 6.1% from 13,100 construction jobs in October 2010 to 12,300 jobs in October 2015.